“My dear Ludo, nobody tells the truth about unemployment!” This quote of Sir Humphrey Appleby during the last episode of the ingenious series Yes, (Prime) Minister, and its subsequent explanations, are cynical, to say the least. Yet, government officials may very well have an incentive to beat about the bush when it comes to answering questions about the labor market, and their statements should in general be taken with a grain of salt. But also plain numbers can sometime be deceptive – even if they are correctly computed and displayed. This post goes to show how important it is to keep in mind what precisely a figure means, by taking a closer look at how the unemployment rate in France recently developed.
We are in the midst of a sanitary crises that will likely have even worse economic consequences than what we experienced in the aftermath of the Great Financial Crises (GFC) of 2008. In an attempt to mitigate the impacts on their citizens, governments all around the world leave no stone unturned and implement costly policies. Given these circumstances, we would expect to see a sharp rise in the unemployment rate. But this is not necessarily the case. Look at the unemployment rate in France in the following graph (Data from INSEE, 2020):
Right after both, the GFC and the onset of the Covid-19 pandemic (the lockdown in France was effective as of March 17, 2020), we see surprisingly low unemployment rates. For the GFC, one can argue that the crisis had its origins in the US, and that it may have taken a while until it reached Europe and manifested itself in a higher unemployment rate. But for the effect of the lockdown, no similar argument can be made: It concerned France directly, and it was immediately effective in the entire country. Of course, short-term work (more on that topic down below) may limit the number of people becoming unemployed, but we still wouldn’t expect the rate to decline. So what else can then explain that unemployment continued its downward trend in the second quarter of 2020?
Let’s have a look at the different aggregates that make up the total population of a country, and how the unemployment rate is defined in these terms. Starting with the total population in the left graph below, we first distinguish between those that are considered to be among the working age population and those that are deemed either too old or too young. Note that the precise age limits of the working age population may differ from country to country, common thresholds are 15 to 64 years, but France does not impose an upper limit. To go from the working age population to the labor force, we have to deduct all individuals that are neither employed nor unemployed (let us broadly define unemployment as not having a job and searching for one). Examples of individuals that fall into this category — working age population but not labor force — are thus stay-at-home moms or dads, or people who have given up on finding a job and are no longer actively looking for one.

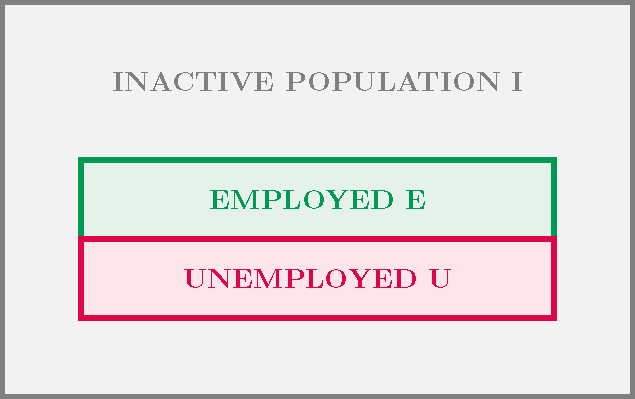
The right graph above gives a slightly different breakdown of the total population. Here, the two groups of employed and unemployed are the center of attention, and the remainder of the population is simply denoted as “inactive”. Before we go back to what’s going on in the French labor market, let’s have a look at the definition of the unemployment rate:
[latexpage] \begin{equation*}\text{U}_\text{Rate} \ = \ \frac{\text{U}}{\text{L}} \ = \ \frac{\text{U}}{\text{E} + \text{U}}
\end{equation*}
The unemployment rate is defined as the share of the unemployed relative to the labor force, which in turn is the group of employed or unemployed. In normal (non-crisis) times, when workers lose their jobs, most of them start looking for a new one and hence move from the group of employed to the unemployed. As a consequence, the numerator in the equation above increases, whereas the denominator remains constant, and so the unemployment rate goes up.
However, during great economic distress, the prospects of finding a new job seem bleak, discouraging some of those who have just lost their jobs (and some unemployed as well). These people then quit the labor force by definition, and do no longer count as unemployed. On top of discouragement, the lockdown also made it virtually impossible for many professions to hire, and thus impossible to apply to those jobs. If, as a consequence, relatively more unemployed quit the labor force, this could serve as one explanation why we observe a plummet in the unemployment rate despite the economic crisis. And this isn’t implausible — it seems intuitive that the longer you have been unemployed, the tougher it becomes to find a job again. Another factor that pushes into the same direction are short-time or furlough schemes, which aim at decreasing the burden of employers when they temporarily face economic hardship, and prevent lay-offs. They have very likely prevented massive lay-offs and hence limited the movements out of the group of employed, while it did not affect the already unemployed.
Let’s visualize what we have discussed, by analyzing the likely flows between the three groups of employed, unemployed, and the inactive population. First of all, we would not expect many people that have been inactive to leave this group, hence the arrows pointing away from the inactive are quite fin. We would expect the same for previously unemployed individuals — the chances of getting a job right now are extremely low. Rather, many unemployed would (be forced to) give up the job search and move to the inactive. For the employed who lose their jobs, we would expect the same, apart from some specific branches, that for instance do not require physical presence, where the job search was still possible during the lockdown. But thanks to the short-term and furlough schemes, many of them would keep their jobs. A possible flow chart, that shows the order of magnitudes of transitions, could then look as follows:
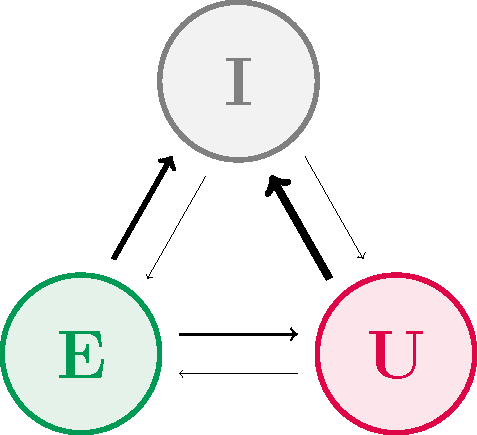
For all the above-mentioned reasons, it is not implausible that the group of unemployed has declined faster than the group of employed, which would translate into a decrease of the unemployment rate — even though intuitively we would not say that the situation on the labor market got any better.
The key take-aways are 1) to keep in mind what numbers actually mean, and to go back to definitions if in doubt, and 2) to be careful about uni-dimensional measures (ie., consisting of a single number) like the unemployment rate. How this figure will move up and down depends on how individuals transfer between the groups shown above, and when we aggregate the six possible directions into one single number, we necessarily lose some information. In combination with other ratios, like the employment rate (share of employed relative to the working age population), the unemployment ratio (share of unemployed relative to the working age population), or the labor force participation rate (labor force relative to the working age population), we would have seen straight away that the fall in the unemployment rate is misleading.
Finally, note two things: Firstly, However plausible all these explanations seem, we need to wait until more disaggregated data is published in order to be sure what has really happened in the French labor market. Secondly, this is only a rudimentary discussion of the labor market, and there is a large number of issues that have not been treated in this post. Those interested can read into the “halo” of unemployment, underemployment, analyses that differentiate between groups of people, in particular with respect to age, and the “working poor”.